How rich and poor Americans spend their money
Expenditure habits of the country's haves and have-nots

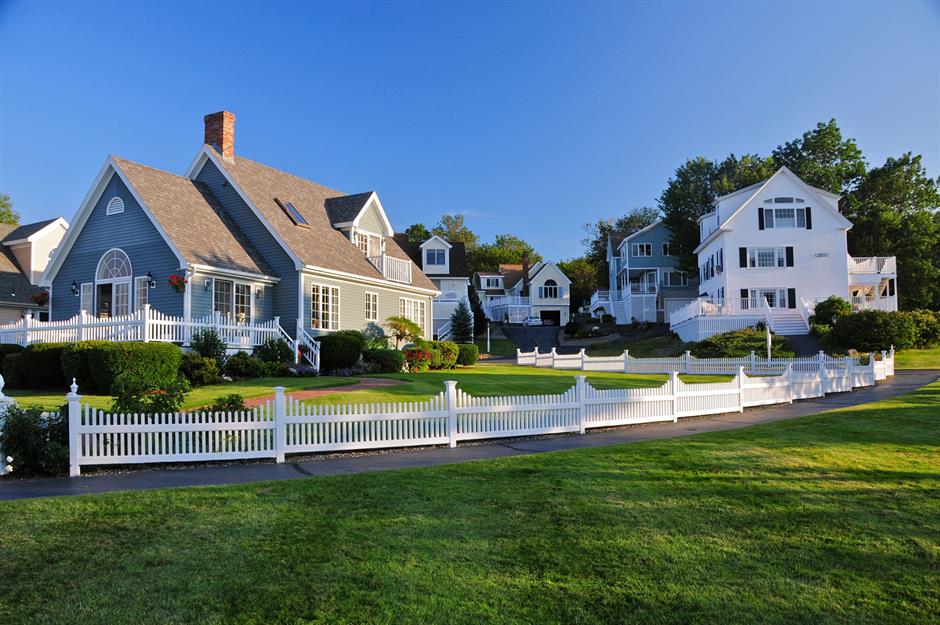
The rich spend 29.6% of their income on housing
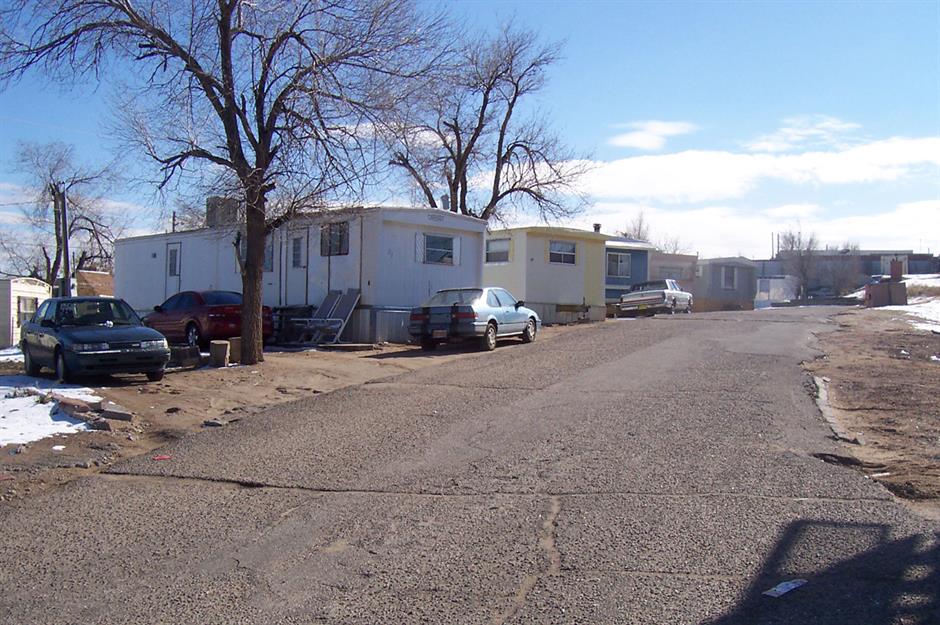
The poor spend 39.8% of their income on housing
Sponsored Content
The rich spend 5% of their income on food at home

The most affluent Americans spend a 20th of their income to groceries. The richest people in the country eat significantly more fruit and vegetables than the poorest 10%. They can afford to shop at the country's finest supermarkets and grocery stores, and splurge on organic produce, fresh fish, and grass-fed, hormone-free meat.
The poor spend 9.9% of their income on food at home
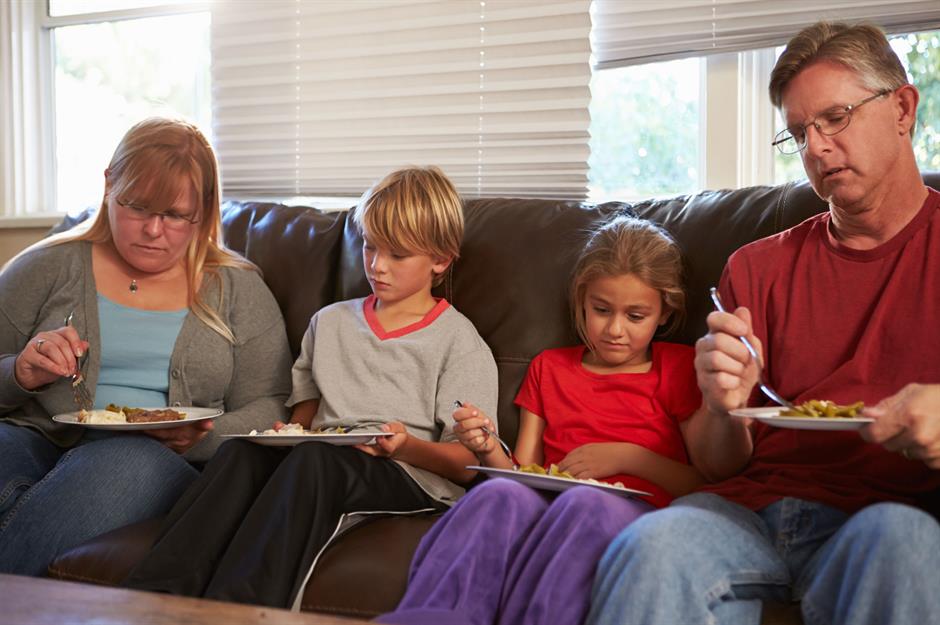
Those on lower incomes typically have a poorer diet than the wealthiest in the nation, but spend almost double the proportion of their income on groceries. Often, the healthiest foods are the most expensive, and poorer neighborhoods don't stock as much healthy food but in fact tend to have more fast-food outlets, according to a report by the Food Research & Action Center. So as well as eating fewer fruit and vegetables, wholegrains and nuts, the poorer 10% have a much higher intake of sugary sodas and high-fat foods, and needless to say, a much higher rate of obesity.
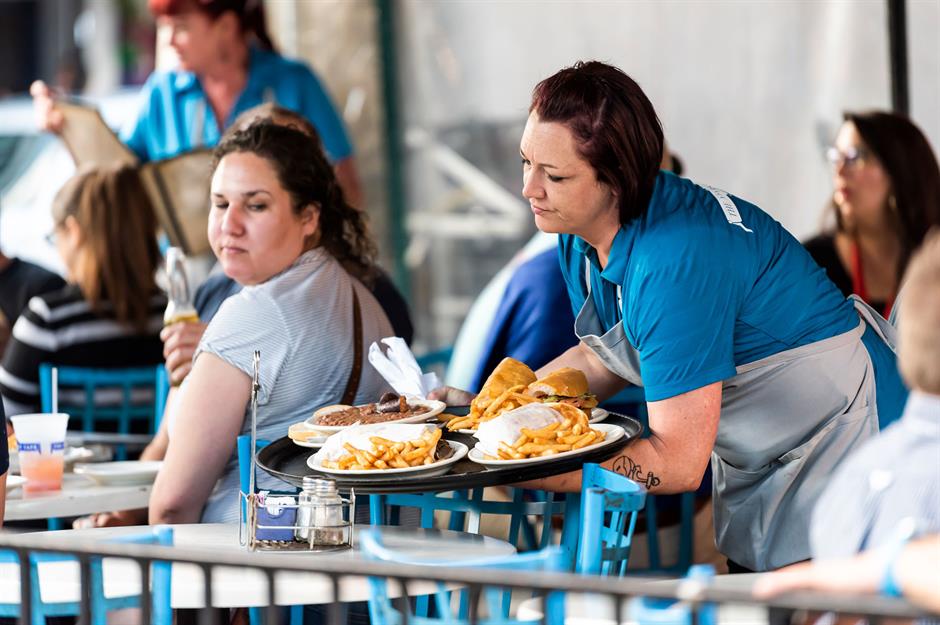
The rich spend 5.4% of their income on eating out

Sponsored Content
The poor spend 6.1% of their income on eating out
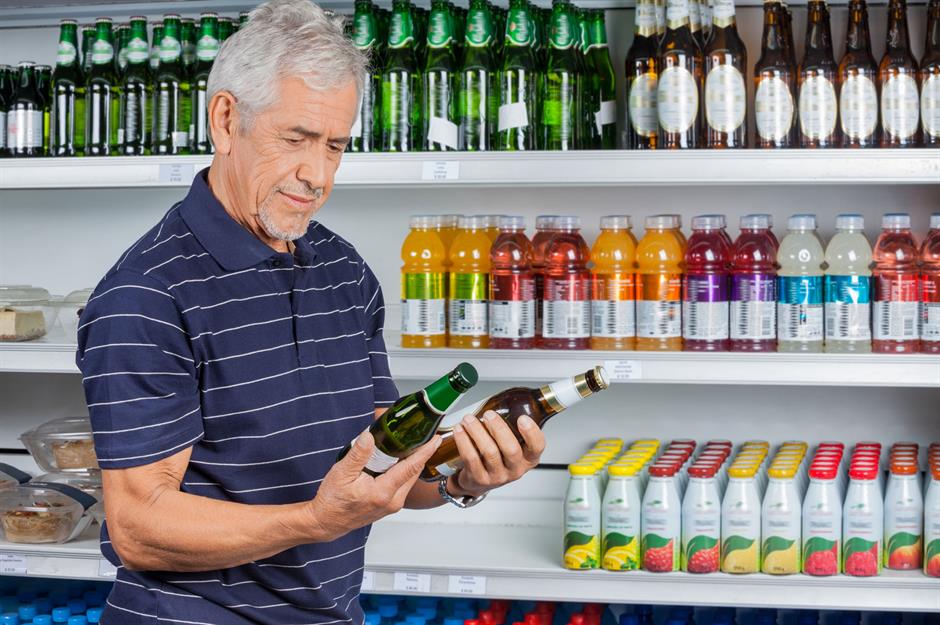
The rich spend 1.1% of their income on alcohol

We often think of alcoholism as a problem of the poor, but binge and heavy drinking are actually more pronounced among wealthier people with higher levels of education. This is backed up by the data which shows the richest 10% in the country spend 1.1% of their income on booze.
The poor spend 0.7% of their income on alcohol
Sponsored Content
The rich spend 1.4% of their income on electricity

The poor spend 3.7% of their income on electricity
The rich spend 1.3% of their income on their cellular phone service

Sponsored Content
The poor spend 1.9% of their income on their cellular phone service

The rich spend 3.2% of their income on household furnishings and equipment
The poor spend 3.3% of their income on household furnishings and equipment
Sponsored Content
The rich spend 3.1% of their income on apparel and services
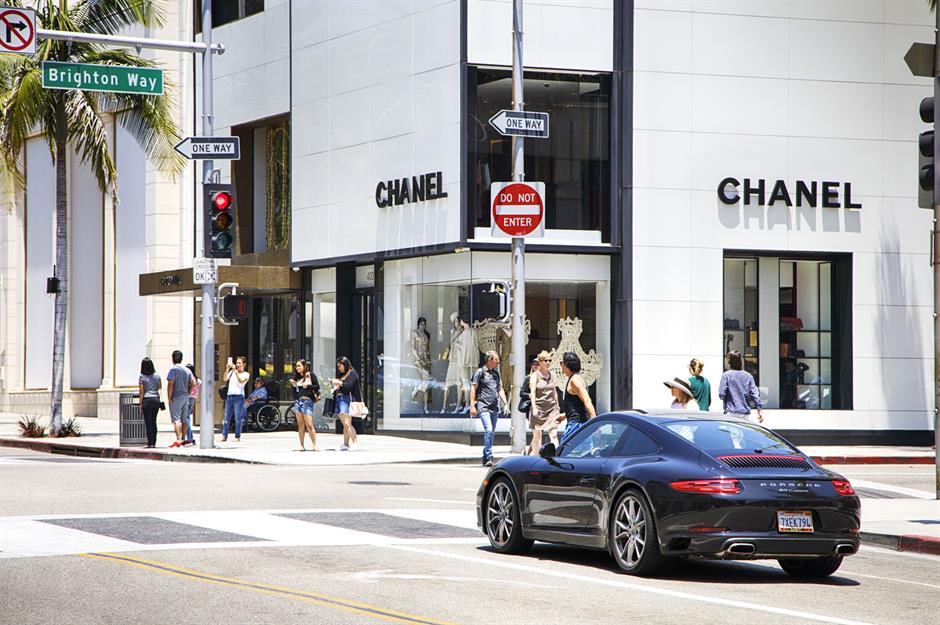
The poor spend 3.6% of their income on apparel and services
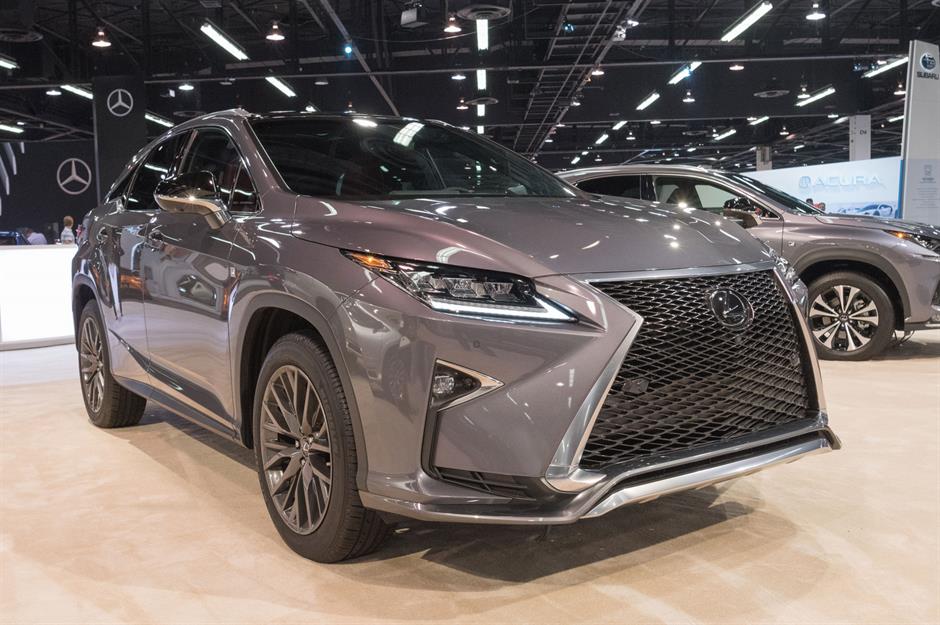
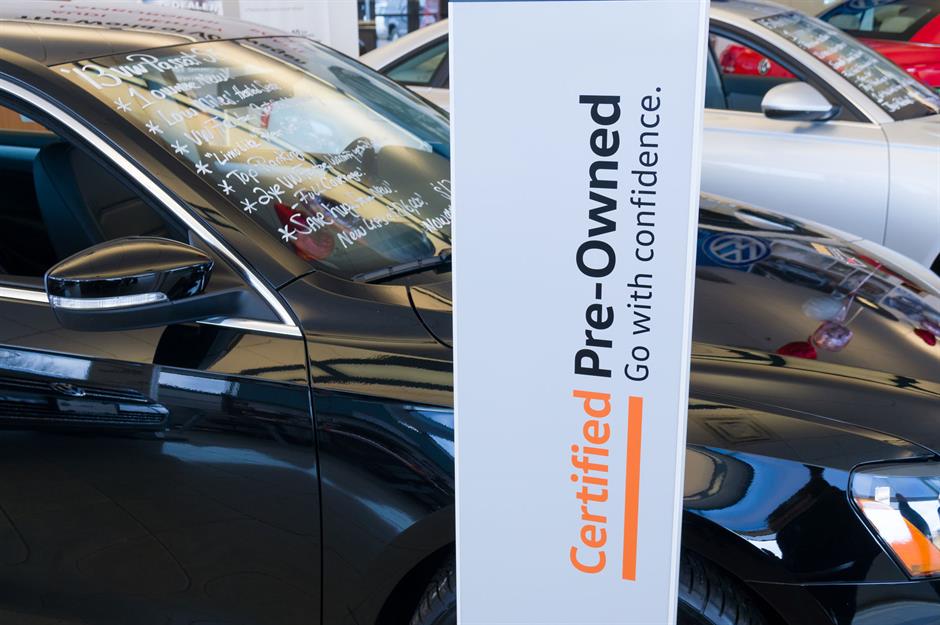
The rich spend 6.8% of their income on vehicle purchases
Sponsored Content
The poor spend 4.9% of their income on vehicle purchases
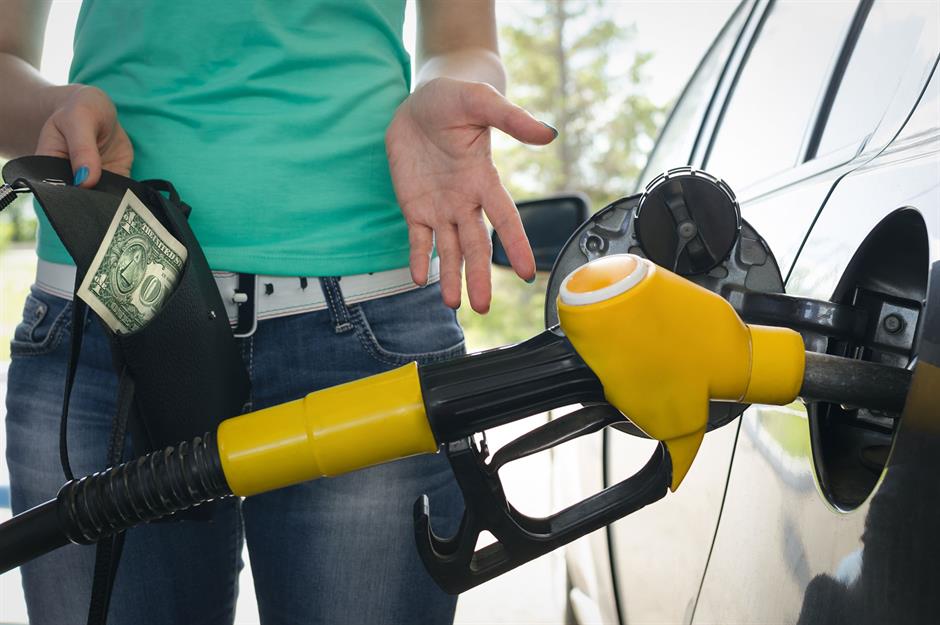
The rich spend 2.1% of their income on gasoline, other fuels, and motor oil
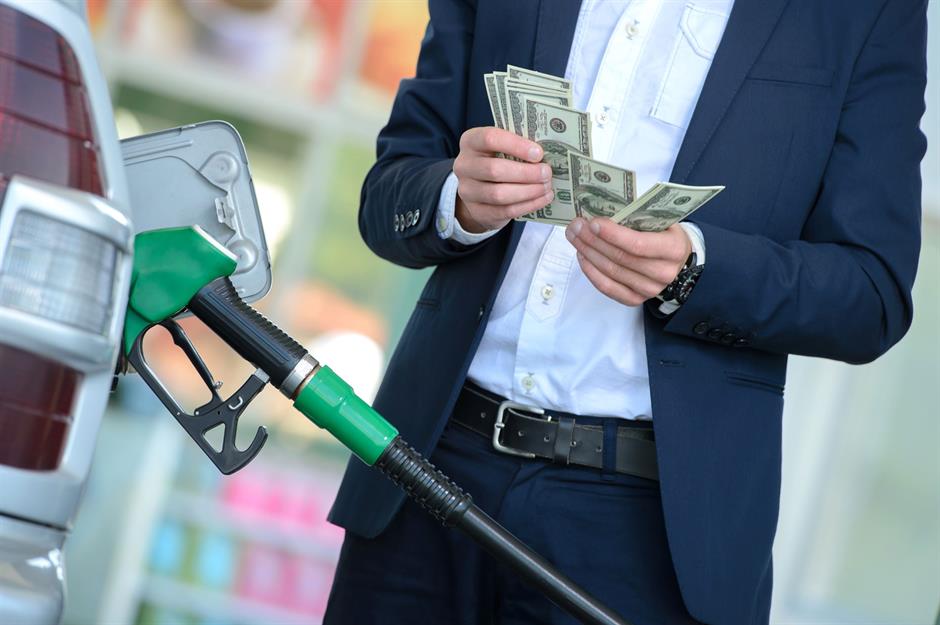
The poor spend 3.5% of their income on gasoline, other fuels, and motor oil
Sponsored Content
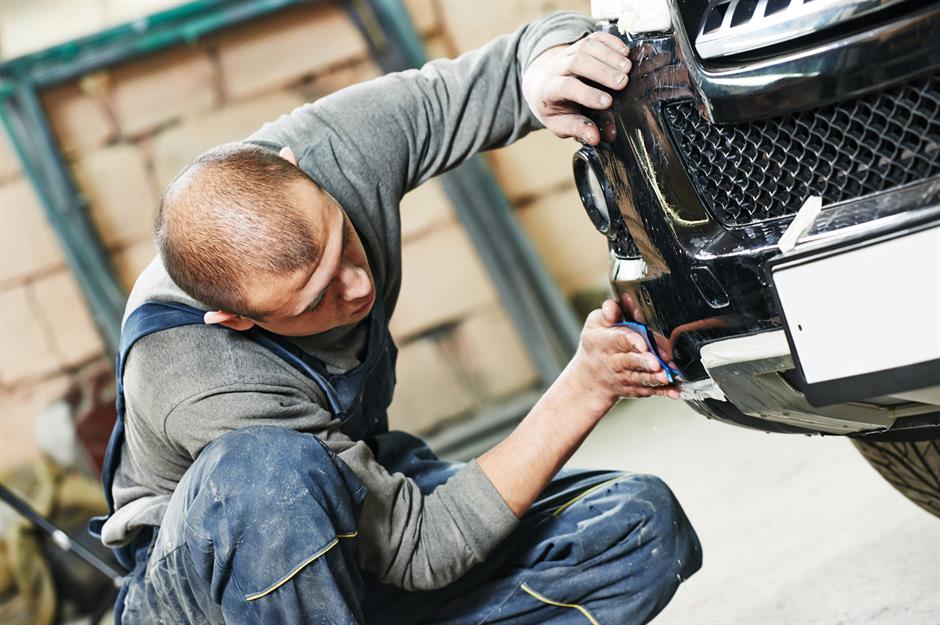
The rich spend 1.8% of their income on vehicle maintenance and repairs
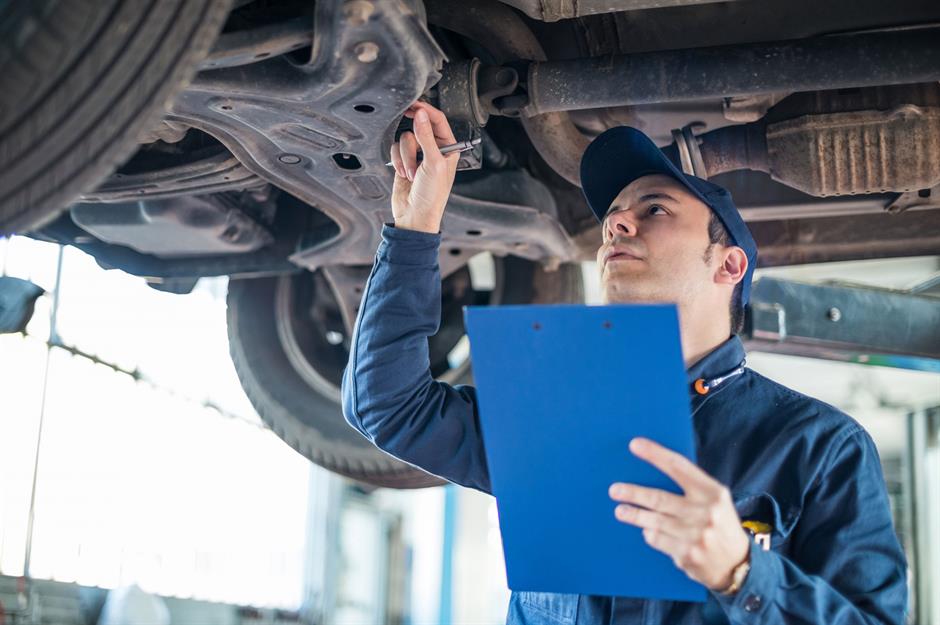
The poor spend 1.3% of their income on vehicle maintenance and repairs
The rich spend 1.1% of their income on vehicle insurance
Sponsored Content
The poor spend 1.9% of their income on vehicle insurance
The rich spend 1.7% of their income on public and other transportation

The poor spend 1.1% of their income on public and other transportation
Sponsored Content
The rich spend 6.1% of their income on healthcare

The poor spend 8.5% of their income on healthcare
The poor aren't quite so fortunate. Their average spend per year is $1,930, which is 8.5% of the typical income. The bottom 10% are often underinsured but the rate of uninsured Americans has dropped since the passage of the Affordable Care Act. Still, the rich have a higher life expectancy. Shockingly, the highest-income Americans live 10 years longer than the poorest.
The highest-paid jobs in America that don't require a college degree
The rich spend 6.1% of their income on entertainment

Sponsored Content
The poor spend 5.2% of their income on entertainment

The rich spend 1.1% of their income on personal care products and services

The poor spend 1.4% of their income on personal care products and services

Sponsored Content
The rich spend 4.9% of their income on education
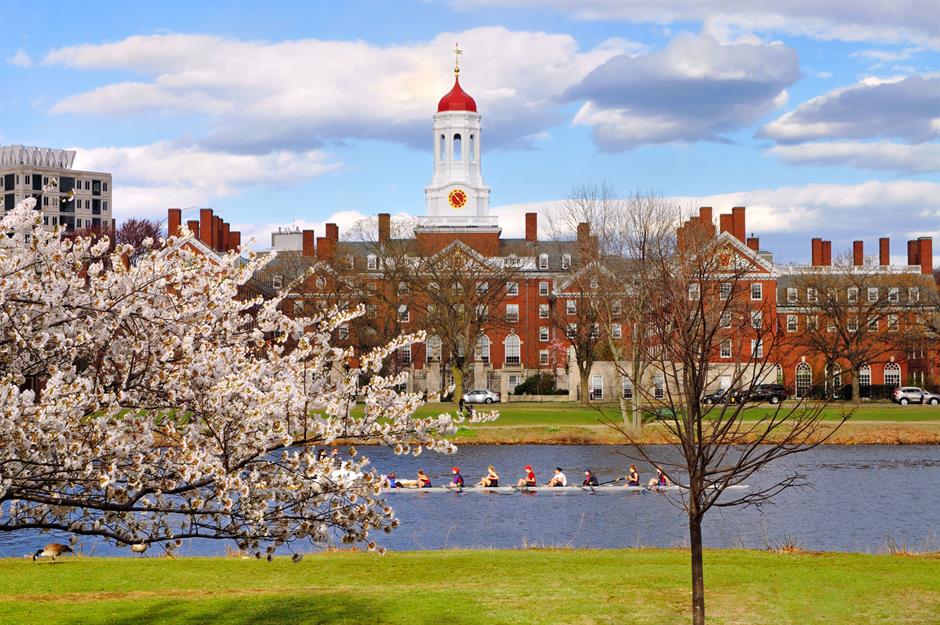
The wealthiest 10% of Americans spend on education, but not as much as you might expect for people who can afford private schools and colleges. Their average yearly expenditure is $3,779.
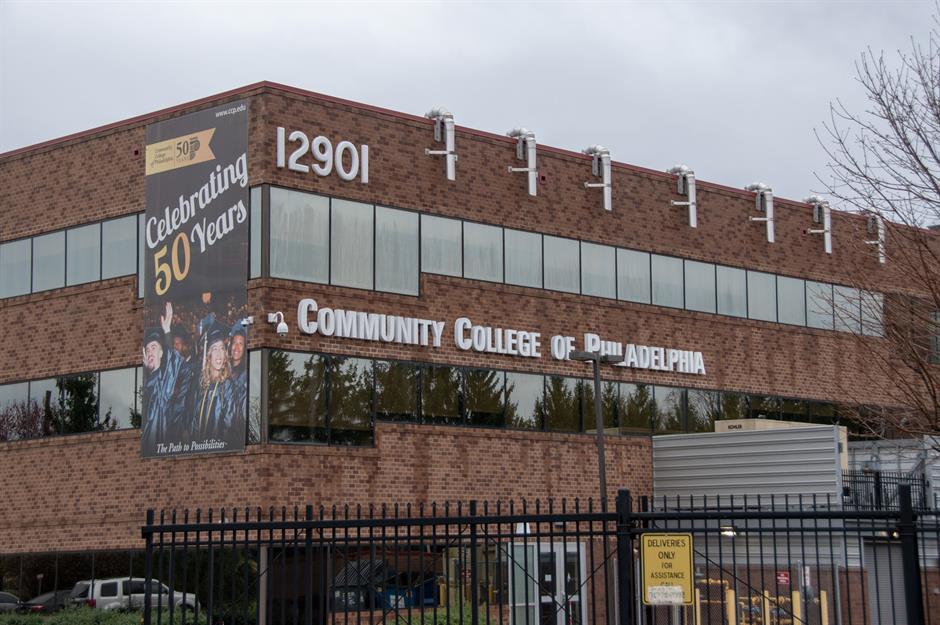
The poor spend 3.9% of their income on education
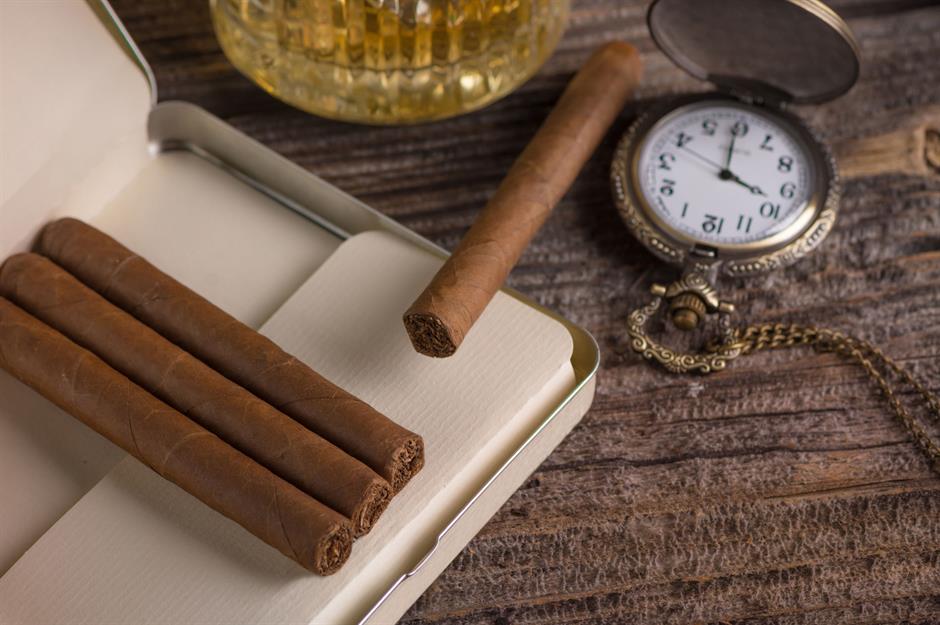
The rich spend 0.2% of their income on tobacco products and smoking supplies
Sponsored Content
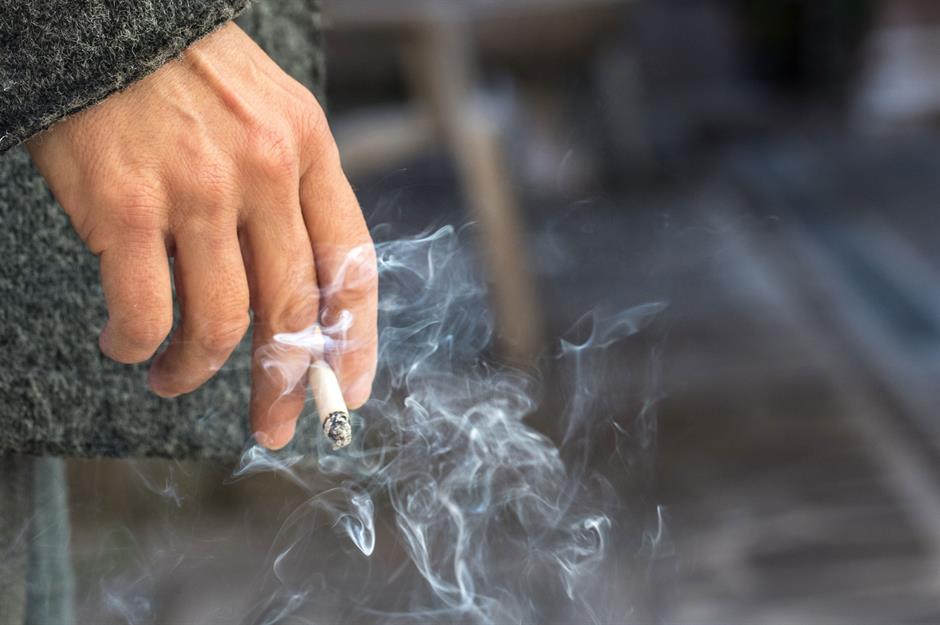
The poor spend 1.1% of their income on tobacco products and smoking supplies
The rich spend 16.2% of their income on personal insurance and pensions

The poor spend 2.2% of their income on personal insurance and pension

Unlike the richest 10%, the lowest-income Americans have far less financial security. They are generally unable to guard against being off work and losing income or plan for a comfortable retirement free from money stresses and strains. Their typical spend per year in this area is just $592.
Sponsored Content
Comments
Be the first to comment
Do you want to comment on this article? You need to be signed in for this feature