Revealed: the income gap in 39 countries worldwide
How the income gap differs around the world in 2025

New York University (NYU) professor Scott Galloway recently issued a stark warning: income inequality is out of control in the US and could even spark a revolution. America is notorious for its wide economic disparities, but how do other nations measure up? And is the gap between the haves and have-nots narrowing anywhere?
Read on to discover the income disparities in 39 selected countries based on the World Bank Gini index, a measure of how income is distributed in each nation that provides a handy way of comparing levels of inequality worldwide.
All dollar amounts in US dollars.
The World Bank Gini income index

Created by Italian statistician Corrado Gini in 1912, the Gini index (also known as the Gini coefficient or Gini ratio) gauges inequality by showing how income or wealth is distributed. Ranging from zero (perfect equality) to 1 or 100 (perfect inequality), it allows for easy comparisons between countries.
The World Bank’s Gini index is based on household surveys and measures either income inequality before taxes and transfers, or consumption per capita, assigning each country a score between 0 and 100. It's worth noting that the recency of the figures varies by nation due to delays in data collection and reporting. Let's start with the most equal of the countries covered.
Slovakia, Gini income index score: 24.1

A shining example of how to tackle economic disparities, Slovakia boasts the world's highest rate of income equality, with its super-low World Bank Gini income index score recorded in 2021. According to the latest data from the World Inequality Database, the top 1% of earners share just 9.2% of national income, the top 10% has 28% and the bottom 50% holds a relatively large 24.3%.
Slovakia's remarkable income equality stems from its progressive tax system, which puts the onus on the rich, along with other factors such as the nation's robust social welfare programs, strong pensions, generous parental leave and its efforts to close the gender pay gap. This has resulted in low poverty rates, healthy income growth across all sectors of society and high intergenerational mobility.
Sponsored Content
Ukraine, Gini income index score: 25.6
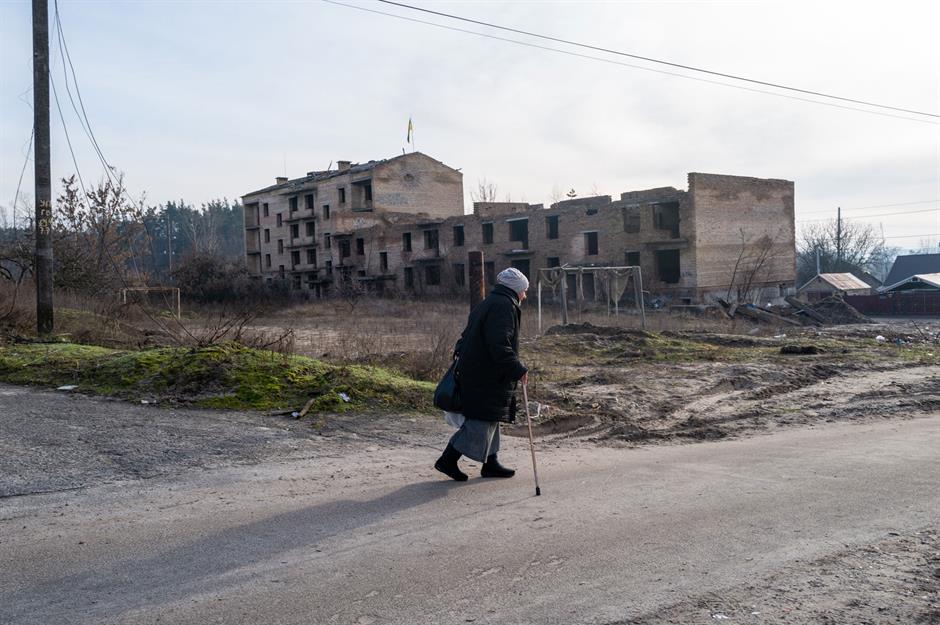
Ukraine's impressive Gini income index score also dates to 2021 when the bottom 50% of earners shared a very respectable 22.6% of the nation's income. But that was before Russia invaded the country.
The war has fuelled income inequality, disproportionately affecting those on lower incomes. A major decline in economic activity, together with negatives such as rising unemployment and escalating inflation has affected the less well-off in the country. The number of people living below the breadline has increased by 1.8 million since 2020, raising the poverty rate to 29%.
UAE, Gini income index score: 26.4

The UAE's Gini income index of 26.4 implies low levels of economic inequality, though it's somewhat out of date as the score was recorded in 2018.
The bottom 50%'s piece of the income pie is surprisingly small at 12.9%, though the figure is on the up, while the top 1%'s share is declining, having fallen from around 20% in 2000 to 16.1%. However, the UAE data doesn't take into account the large population of migrant workers from developing countries who survive on very little. A striking 88% of the UAE population is made up of migrants, 60% of whom are on low incomes, earning less than the minimum requirement to open a bank account in the country.
Belgium, Gini income index score: 26.6

The income of the bottom 50% of earners in Belgium makes up a much better 20.4% of the total, though their share has declined since the pandemic and inequality is on the rise (the Gini income index score is from 2021). At the other end of the spectrum, the share of the top 1% of earners is increasing, though it remains comparatively modest at only 8.5%.
Belgium's progressive tax and transfer policies ensure the rich pay their fair share, and the recent increase in inequality is more to do with the appreciation of 'risky' assets like stocks, cryptocurrencies and so on, rather than a decline in wages for those on lower incomes. Plus, Belgium has the smallest gender pay gap among OECD countries at just 1.1% – the average for all nations in the grouping is 11.6%.
Sponsored Content
Norway, Gini income index score: 27.7

Like other Nordic nations, Norway scores well for income equality but lower for wealth equality, despite a large proportion of part-time workers, which would typically increase income disparities. This is largely due to the country's excellent welfare system, extensive subsidised public housing and generous public pensions. There simply isn't a pressing need for those on low and middle incomes to accumulate wealth since the state is hugely supportive.
In terms of the national income breakdown, the bottom 50% shares a hefty 24.4%, though at the end of the 1980s the figure was as high as 28.7%. The top 1%, on the other hand, has 9.3% and the top 10% of earners holds 30.6%.
Poland, Gini income index score: 28.5

Recorded in 2021, Poland's Gini income index score of 28.5 suggests low levels of economic inequality. However, according to an article by Pawel Bukowski published on the news site Notes from Poland, the true figure is significantly higher. The article highlights the limitations of the World Bank's Gini income index which, as we've mentioned, is based on household surveys. These surveys can be unreliable.
Incidentally, the bottom 50% of earners have seen their share of national income slide since the fall of communism in the country, dropping from 28.2% in 1988 to 19.5% in the early 2020s.
Ireland, Gini income index score: 30.1

Ireland has comparatively high levels of income equality given its Gini income index score of 30.1, which dates from 2021. This is partly due to the country's progressive tax system. On another note, Ireland's gender pay gap is among the narrowest globally at just 2%.
Nevertheless, the bottom 50%'s proportion of national income has declined slightly over the past few decades, down from over 22% in the late 1990s to 20% in the early 2020s, while the top 1% of earners now share 13.6%, up from 9.7% in 1996. Moreover, for certain vulnerable groups, such as one-parent families and those in working-age households with no paid work, poverty and deprivation levels have remained consistently high, according to research funded by the charity Community Foundation Ireland.
Sponsored Content
Austria, Gini income index score: 30.7

Austria's Gini income index score, which dates from 2021, is also decent for a European country. At 22%, the bottom 50% of earners have an even larger share of national income than their counterparts in Ireland and the top 1%'s proportion is smaller at 11.5%.
Austria's equitable tax policy and strong welfare state are the key drivers and go a long way towards offsetting the effect of the country's relatively high number of part-time workers, which would usually make for more pronounced income inequality.
France, Gini income index score: 31.5

France's enviable social safety net, with programmes like extensive socialised healthcare and generous unemployment benefits, contributes to its comparatively low levels of income inequality, with a Gini income index score of 31.5 recorded in 2021. The country also isn't afraid to tax the richest in society at levels other nations would baulk at.
The top 1% claims 12% of the national income, the top 10% possesses 34.3% and the bottom 50% receives 20.4%. Still, this distribution has become more unequal over the past two decades, with the wealthiest increasing their share and the poorest experiencing a modest decline.
Canada, Gini income index score: 31.7

Canada has long enjoyed much better income equality than its neighbour to the south and its World Bank Gini income index score, which dates from 2019, is considerably lower. But income disparities are worsening in the Great White North and the wide gender pay gap of 17.1% is an ongoing concern.
Amid the post-pandemic inflation surge, low-income Canadians have been left behind and campaigners are calling for a more progressive tax system and improved welfare programmes to address the issue. The bottom 50%'s share of total national income has declined since 2019, while the top 1% have gained an even bigger piece of the pie.
Sponsored Content
UK, Gini income index score: 32.4
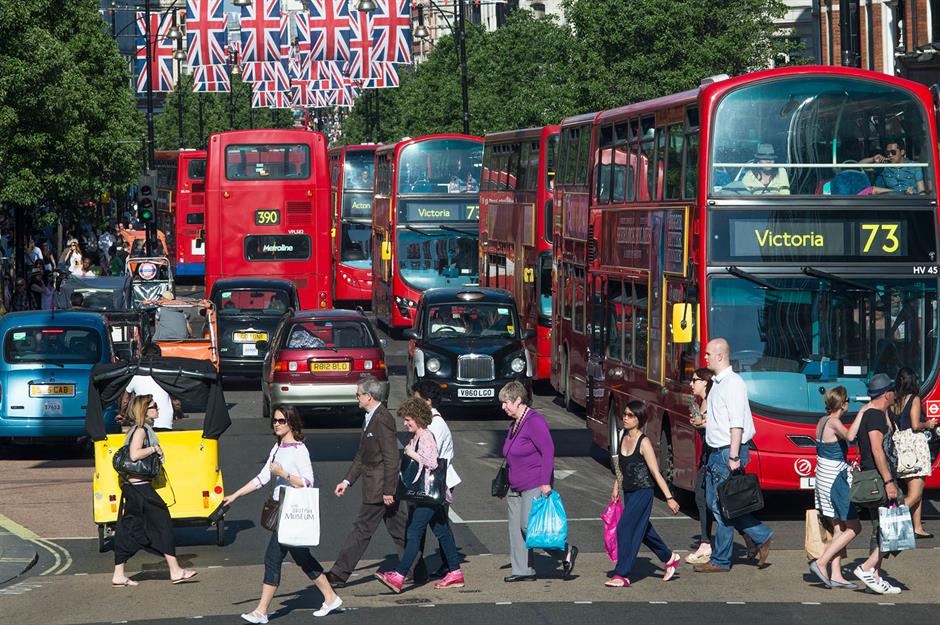
The UK's World Bank Gini income index score is also from 2021. Since then, income disparities have increased in the country, particularly among retired households, as benefits have reduced in real terms. Inequality among retired households has actually hit a record high according to the Office for National Statistics.
However, income inequality hasn't changed much in the UK since the early 1990s, though it's higher than it was in the 1960s and 1970s. And while the top 1% of earners have seen their share increase, inequality has reduced among the rest of the population. As per the latest data, the top 1% holds 13.1% of the UK's total income, the top 10% has 36.2% and the bottom 50% shares 20.1%.
Germany, Gini income index score: 32.4

Germany's Gini index score, which is based on data from 2020, is above the EU average. The country's top 1% of earners now hold a larger share of national income compared to the early 2000s, with their portion rising from around 10% to almost 13%. Meanwhile, the bottom 50%'s percentage has decreased from about 22% to 19.2%. It's important to note that these figures vary significantly across Germany.
Wages in the east of the country remain much lower than those in the west, even 35 years after reunification. Income inequality also differs greatly from municipality to municipality and city to city.
India, Gini income index score: 32.8

Income inequality has ballooned in India this century. Back in 2000, the top 1% of earners held 15.5% of national income. They now claim 23.1%. At the other extreme, the bottom 50% had 18.5% at the start of the 2000s but now share only 13.3%.
Though hundreds of millions of Indians have been pulled out of poverty, the very rich have become much richer. Campaigners have called for a more progressive tax system to deal with the issue and concerted action to bridge India's gender pay gap, which is among the widest in the world.
Sponsored Content
Japan, Gini income index score: 32.9

Japan's World Bank Gini income index score dates from way back in 2013. The country has relatively low levels of income inequality by regional standards, though the gender pay gap is huge at 22.3%.
Japan's substantial income tax rate for the highest earners and steep inheritance tax rate, which is the highest in the world, help keep both income and wealth inequality in check. But there's still a gulf between the richest and poorest. When it comes to income distribution, the top 1% of earners share 12.7%, while the bottom 50% have 18.2%.
Switzerland, Gini income index score: 33.7

Switzerland enjoys a very high standard of living with a low poverty rate (8.2%), while the highest earners face an income tax rate of around 51%.
Although income inequality exists in the country, it has remained relatively stable in recent decades, bucking the global trend. The top 1% holds 9.8% of the national income, while the bottom 50% has 23.9%. However, many other European countries have narrower gaps between rich and poor.
Spain, Gini income index score: 33.9

Spain's Gini income index score of 33.9 dates from 2020. According to recent research from CaixaBank, income equality has improved in the last few years, so the current score is likely much lower.
The study found that while income inequality spiked during the pandemic, support programmes mitigated the impact. And a strong labour market, together with falling unemployment, have led to a pronounced decrease in income disparities in the country post-COVID. The bottom 50% of earners shared 23.1% of total income in 2023, up from under 20% in 2017, while the top 1%'s portion dropped from 12.7% to 12.1% during the same period.
Sponsored Content
Australia, Gini income index score: 34.3

Australia has a reputation for being a classless meritocracy but income inequality is growing in 'the land of the fair go'. The World Bank Gini income index score of 34.3 relates to 2018. The figure stood at 30.6 in the early 2000s and since 2018, it has risen further.
The surging cost of living, which has disproportionately affected low and middle-income Australians, is a key factor in the widening gap. This is in spite of the country's bumper national hourly minimum wage of AU$24.10 ($15.06/£12.11), which is the highest in this round-up. Distribution-wise, the top 1% of earners share 9.9% of the country's total income, up from around 9% in the early 2000s, while the bottom 50%'s portion has declined from about 18% to 17.2%.
Italy, Gini income index score: 34.8

Italy's Gini income index score of 34.8 dates from 2021. While the country has made significant progress narrowing its gender pay gap, income inequality has grown in recent years. This comes down to the country's tax system, which is skewed towards the very rich.
A recent study by the Sant'Anna School in Pisa and the University of Milano-Bicocca revealed that the top 1% pay less tax proportionally than the remaining 99% of Italians. Since the early 2000s, the top 1% of earners have seen their share of the national income increase from around 10% to 12.3%. In the meantime, the bottom 50%'s piece of the pie has dropped from around 17% to 16.6%.
New Zealand, Gini income index score: 34.9

New Zealand is absent from the World Bank data but according to financial info site World Economics, its Gini income index score was last measured in 2019 at 34.9.
Like Australia, New Zealand offers a very generous minimum wage but the gap between rich and poor has risen over the past few decades. According to independent news and analysis site The Conversation, this stems from higher-bracket tax reductions in the 1980s and welfare cuts the following decade. Looking at the latest breakdown, the top 1% now holds 12.1% of national income, up from around 8% in the mid-1980s. And though the bottom 50%'s share has also increased over the same period, it has done so at a slower rate.
Sponsored Content
Russia, Gini income index score: 35.1

Russia's Gini income index figure was recorded in 2021 before its invasion of Ukraine. War-related spending has benefited some Russians, leading to the rise of the so-called war middle class and new pro-Putin oligarchs. But while a tighter labour market has led to rising wages for many, inflation has skyrocketed, offsetting a lot of the gains.
In any case, a recent analysis found that two-thirds of Russians make under $415 (£333) a month, while the number of richer Russians has been understated, implying a much wider income gap than previously thought. According to the World Inequality Database, the top 1% of earners share 23.8% of the national income, with the bottom 50%'s portion much lower at 15.7%.
China, Gini income index score: 35.7

China's economic boom since 1978 has been accompanied by a massive rise in income inequality, which is astonishing for a communist country. Research from America's Stanford University attributes the widening disparities to disproportionate gains among the richest in society and the limited effectiveness of the state's redistribution efforts.
In 1978, the top 1% of earners shared 6.5% of China's national income and the bottom 50% held 25.2%. Fast-forward to 2023 and the top 1%'s portion had swelled to 15.8%, while the bottom 50%'s plunged to 13.5%.
Vietnam, Gini income index score: 36.1

Income inequality has more or less stagnated in Vietnam this century, bar a blip around 2010 when disparities shot up temporarily. According to the latest figures, the top 1% of earners share 15.7% of the country's income, the top 10% have 43.8% and the bottom 50%'s portion stands at 14.6%.
The Vietnamese government has attempted to close the gap between rich and poor through measures such as increasing the national minimum wage, but these initiatives have done little to mitigate the disparities.
Sponsored Content
Indonesia, Gini income index score: 36.1
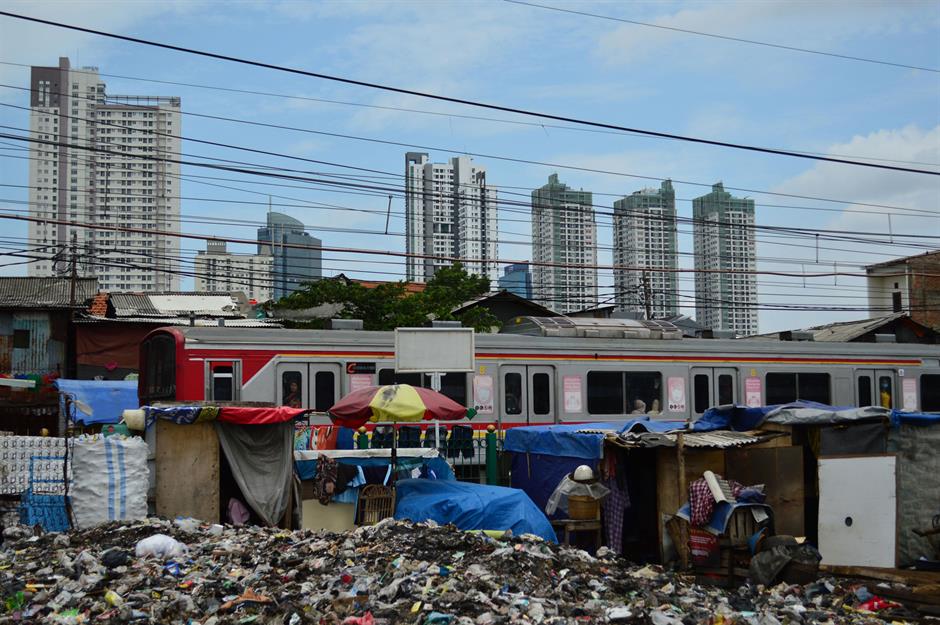
Indonesia's Gini income index score relates to 2023, so it's among the most up-to-date figures from the World Bank.
Despite a decrease in poverty in Indonesia, income inequality has risen over the past few years. Experts attribute this to government policy choices such as luxury tax cuts benefiting the wealthy and fuel subsidy cuts impacting the poor. As of 2023, the top 1% of earners held 17.8% of the national income, with the bottom 50%'s share at 12.4%. This contrasts sharply with 2016, when the shares were almost on a par.
Kenya, Gini income index score: 38.7
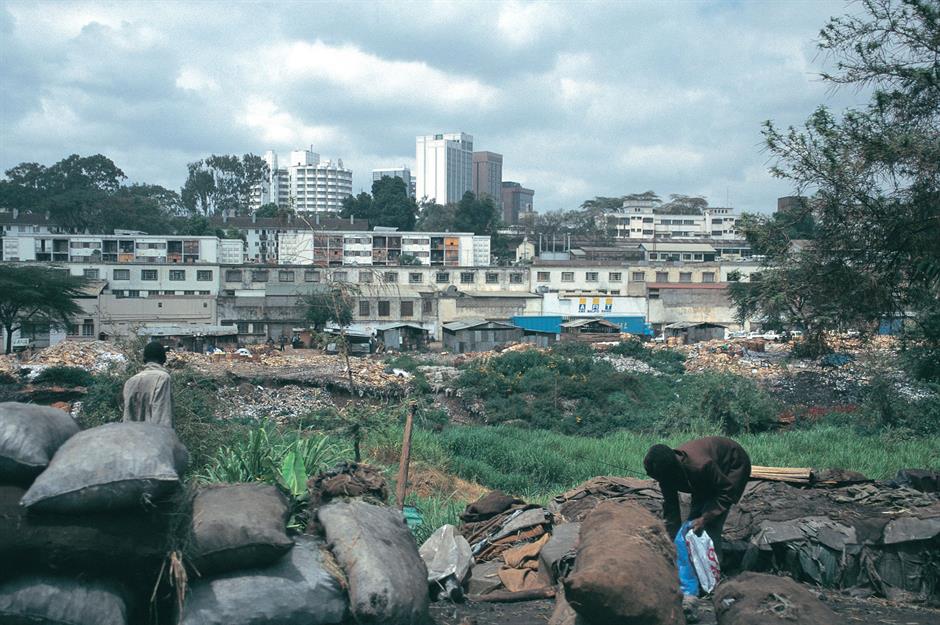
Kenya's Gini income index score of 38.7 dates from 2021 and according to the most recent update, the top 1% of earners' share of the national income eclipses that of the bottom 50% by 2% – 15.9% against 13.9%. Meanwhile, the top 10%'s portion sits at almost 50%.
Wealth inequality is much starker still. Shockingly, the top 0.1% of the population owns more wealth than the remaining 99.9%, according to data from Oxfam. The charity attributes these gaping economic disparities to a number of reasons, from a lack of government welfare spending to widespread tax-dodging by rich individuals and corporations.
Bulgaria, Gini income index score: 39.0

Bulgaria has the highest levels of income inequality in the EU, with its score of 39.0 dating from 2021. While the shares of the top 1% and bottom 50% of earners are similar at 16.9% and 17% respectively, the top 10% holds an ample 41.9% of the national income.
Experts ascribe the wide gap between those on high and low incomes to factors like unfair tax rates, government inaction when it comes to assisting people living in poverty and unequal access to public services and decent-paying jobs.
Sponsored Content
Peru, Gini income index score: 40.3

Latin America and the Caribbean is the world's most unequal region, with less income inequality as a whole than Africa. Though not the worst in the region, Peru's Gini income index score of 40.3 from 2022 is high by international standards.
The country's top 1% of earners share a substantial 26.9% of the national income and the bottom 50% has only 8.9%. Seven out of 10 Peruvians are poor or vulnerable to falling into poverty, according to the World Bank. Economic opportunity and wealth are largely confined to the capital Lima and other major cities, with rural areas seriously neglected, while white and mixed-race Peruvians earn considerably more on average than indigenous Peruvians and those of African descent.
Philippines, Gini income index score: 40.7

The Philippines has long been riven by income inequality, with its Gini score of 40.7 from 2021 among the highest in East Asia. The top 1% of earners hold 16.6% of the country's national income, 2.3% more than the bottom 50%.
The World Bank suggests the persistent gap between high and low-income earners partly results from unequal access to education, hampering economic opportunity for less well-off families. There's also a very wide gender pay gap in the nation and a lot of job discrimination against those living with disabilities. Plus, the Filipino government is failing to address severe poverty. According to a December 2024 survey, more than a quarter of households are experiencing hunger, the highest rate since the COVID-19 pandemic.
Malaysia, Gini income index score: 40.7

Malaysia has wide income disparities, with a Gini score of 40.7 recorded in 2021. However, inequality has fallen over the past couple of decades, and the bottom 50%'s share of national income surpassed that of the top 1% in 2016.
Still, Malaysia is by no means an egalitarian society when it comes to income. The rich still don't pay their fair share of taxes, while spending on welfare, public education and other social programmes that would benefit less affluent Malaysians remains inadequate.
Sponsored Content
USA, Gini income index score: 41.3

The gap between those on high and low incomes is cavernous in the US and grows ever wider, with the Gini income index score of 41.3 from 2022 on the rise. According to the latest breakdown, the top 1% of earners now claim 20.7% of the national income, up from 17.3% in 2000, while the bottom 50%'s share has dropped from 15.1% to 13.4% over the same time frame. According to the latest figures from the Federal Reserve, almost 98% of the nation's wealth is held by the top 50% of Americans.
Many factors contribute to America's glaring income inequality. They include tax policies that favour the wealthy, a low federal minimum wage, weak labour unions, systemic racism that disadvantages Black and Hispanic Americans, a persistent gender pay gap, an inadequate social safety net and the lack of universal healthcare. Globalisation and automation have also played a part, reducing the number of high-paying blue-collar manufacturing jobs.
Chile, Gini income index score: 43.0

Economic inequality has reportedly reached a 30-year high in Chile and the middle class in the country is shrinking, despite the bottom 50% gaining some ground. The country's Gini income index score dates from 2022.
Chile's enduring income inequality results from several factors, such as insufficient investments in education and welfare, not to mention a consistent failure on the part of successive governments to introduce fairer taxes.
Singapore, Gini income index score: 43.3

The World Bank doesn't include Singapore in its Gini income index, though according to the country's statistics office, the relevant Gini figure stood at 43.3 in 2023, the lowest in two decades. But while the number is on the wane, it does remain super-high.
Singapore offers excellent economic opportunities for many, but there's no minimum wage and social security is very limited. Coupled with the fact the highest rate of income tax is only 24%, it's little surprise that income disparities are so wide in the city-state.
Sponsored Content
Mexico, Gini income index score: 43.5

Likewise, income inequality has improved in Mexico this century but disparities continue to be extremely wide in the country. The top 1%'s share of national income might have declined while the bottom 50%'s has risen, but the latest figures of 21.6% and 7.6% respectively are nothing to be proud of.
Still, Mexico is on the right track. According to Spanish newspaper El País, minimum wage increases, a strengthening of labour unions, the growth of small businesses and a decrease in rental prices are some of the key factors driving improved income equality in the nation.
Türkiye, Gini income index score: 44.4

Türkiye's Gini income index score of 44.4, which relates to 2021, is poor and on the rise. Since the 2007/2008 Financial Crisis, the top 1% of earners have seen their share of the national income shoot up from 16.9% to 24.4%, while the bottom 50%'s portion has plunged from 15.1% to 12.4%.
Workers get a relatively small piece of the country's economic pie, and the tax system is regressive, with the rich paying less than they should and the poor paying more. Additionally, Türkiye has one of the largest gender pay gaps in the world – the widest in this round-up, as a matter of fact.
Panama, Gini income index score: 48.9
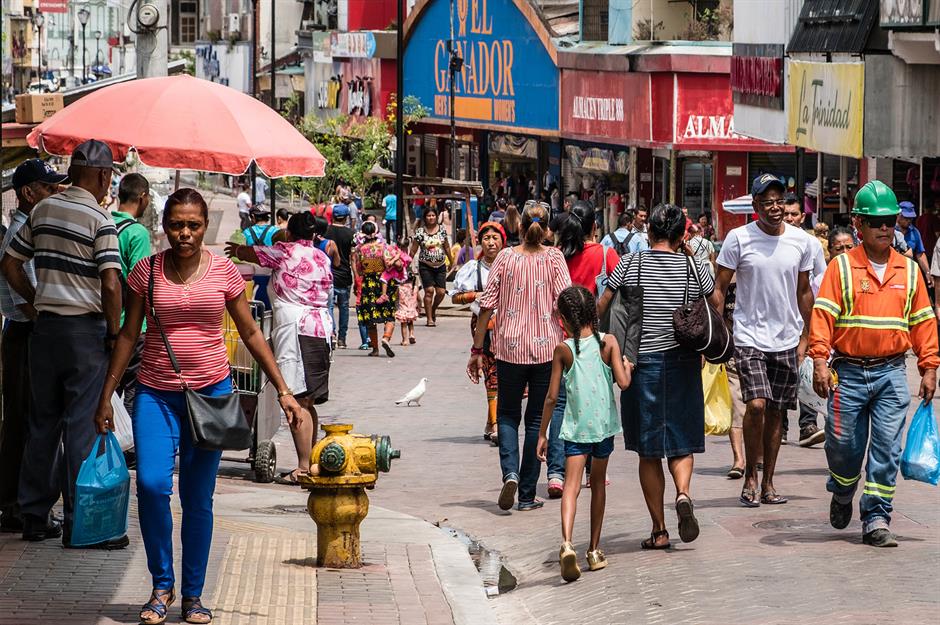
Economic inequality has been described by the World Bank as Panama's Achilles' heel, with its Gini income index score of 48.9 recorded in 2023.
Incomes are comparatively high in the eponymous capital city but in the countryside comarcas, which are home to much of the nation's indigenous population, the poverty rate is a staggering 76%. This racial and urban/rural divide persists due to a tax policy that effectively rewards the rich and punishes the poor, a lack of economic opportunity away from Panama City and natural disasters that disproportionately affect the least affluent.
Sponsored Content
Brazil, Gini income index score: 52.0
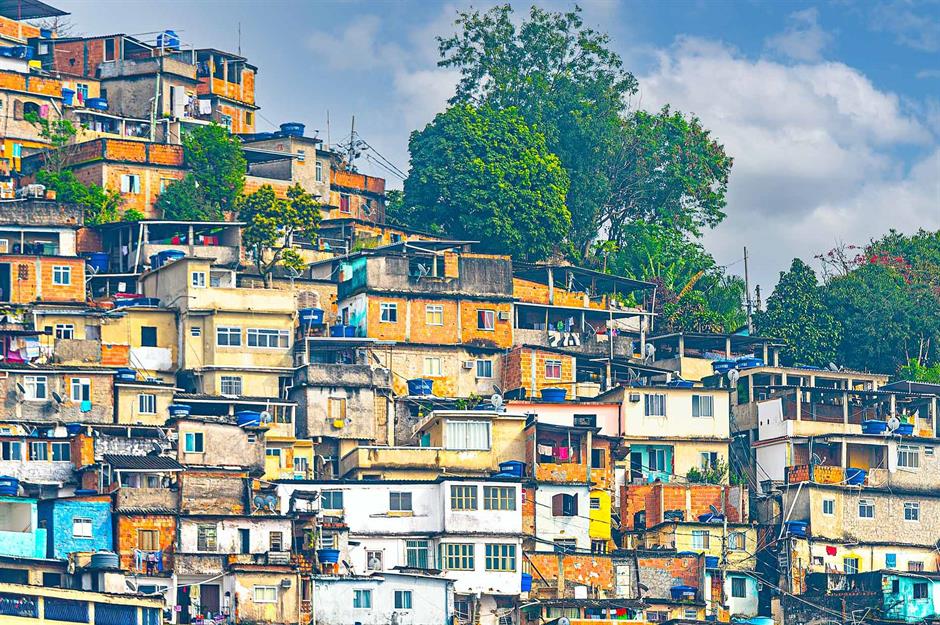
Millions of people have been pulled out of poverty in Brazil over the past few decades. However, extreme income inequality remains a major challenge, with the Gini income index score of 52.0 recorded in 2022 exceedingly high.
The top 1% of earners share 21.1% of the national income, though the figure has fallen from 22.1% since 2000. But the bottom 50%'s portion has decreased too, dropping from 9.2% at the start of the 21st century to 9.1%, though it peaked at 10.8% in 2014. Again, the disparities largely come down to an unfair tax system and inadequate investments in social policies, according to Oxfam.
Botswana, Gini income index score: 53.3

Income inequality is decreasing in Botswana. Its Gini income index score relates to 2015 and has certainly improved since then. The top 1% of earners now share 22.7% of the national income, down from 27.4% in 2000, while the bottom 50%'s percentage has increased from 5.2% to 9.1%.
Nonetheless, the gap between rich and poor is enormous. Income inequality in Botswana stems from wealth concentration amongst the elite, over-dependence on mining (which benefits only a small section of society), limited access to education, high unemployment, gender inequality and a pronounced urban-rural divide. Compounding the disparities are weak tax and welfare systems.
Eswatini, Gini income index score: 54.6

Africa's last absolute monarchy, Eswatini is one of the continent's most economically unequal countries. Much of the nation’s wealth is controlled by King Mswati III, who leads a ridiculously lavish lifestyle while the majority of the population endure extreme poverty. The country's Gini income index score of 54.6 dates from 2016.
Low wages, high unemployment and a reliance on low-productivity sectors like subsistence agriculture underpin the country's economic inequality. These issues, combined with limited access to education and inadequate social support, perpetuate the cycle of poverty and hinder economic opportunities for many Swazi people.
Sponsored Content
Colombia, Gini income index score: 54.8

Colombia's Gini income index score of 54.8, which dates from 2022, is the worst in Latin America. The top 1% of earners share 17.9% of the national income, while the bottom 50% share a meagre 6.4%.
The country lacks a large middle class and government assistance for the poor is grossly deficient, which puts the brakes on social mobility. Making matters worse, Colombia has a regressive tax policy that rewards the rich, though the current left-wing government recently introduced a wealth tax. Among the few positives is Colombia's narrow gender pay gap, which stood at just 1.9% in 2022.
South Africa, Gini income index score: 67.0
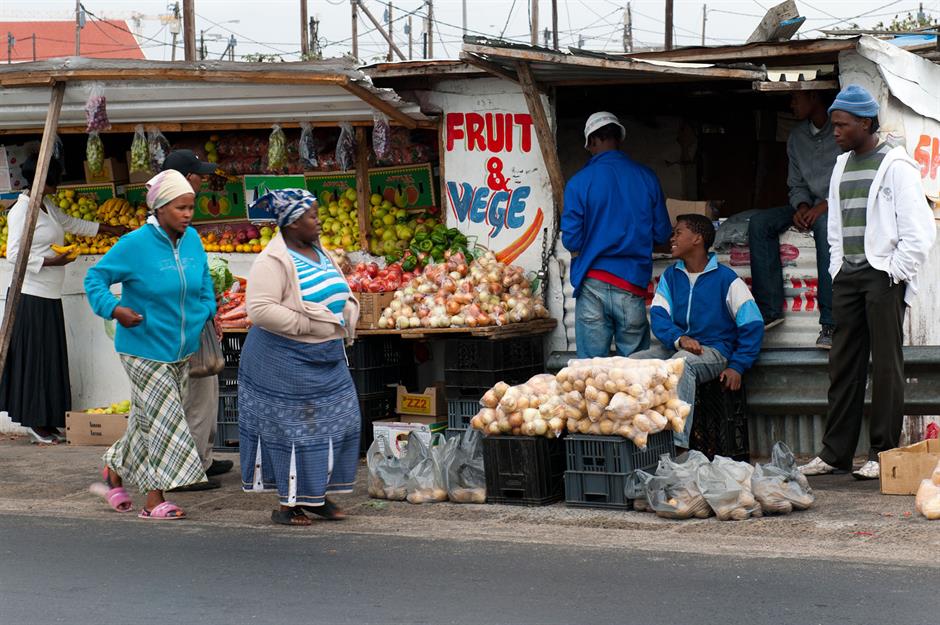
The most economically unequal country in the world, South Africa is plagued by alarming income disparities. Its Gini income index score, which was last recorded in 2018, is sky-high at 67.0. The top 1% of earners share 19.3% of the national income and the top 10% hog 65.4%, while the bottom 50% hold just 5.8%.
South Africa's income inequality is rooted in the racist apartheid system, which ended in the early 1990s. Subsequent governments have failed to address income distribution effectively, exacerbating the gap between the haves and have-nots. The white minority continues to earn significantly more than the Black majority, with the average income of white households a whopping five times higher than that of their Black counterparts, according to recent statistics.
Now discover the countries that will rule the world in 2039
Comments
Be the first to comment
Do you want to comment on this article? You need to be signed in for this feature